
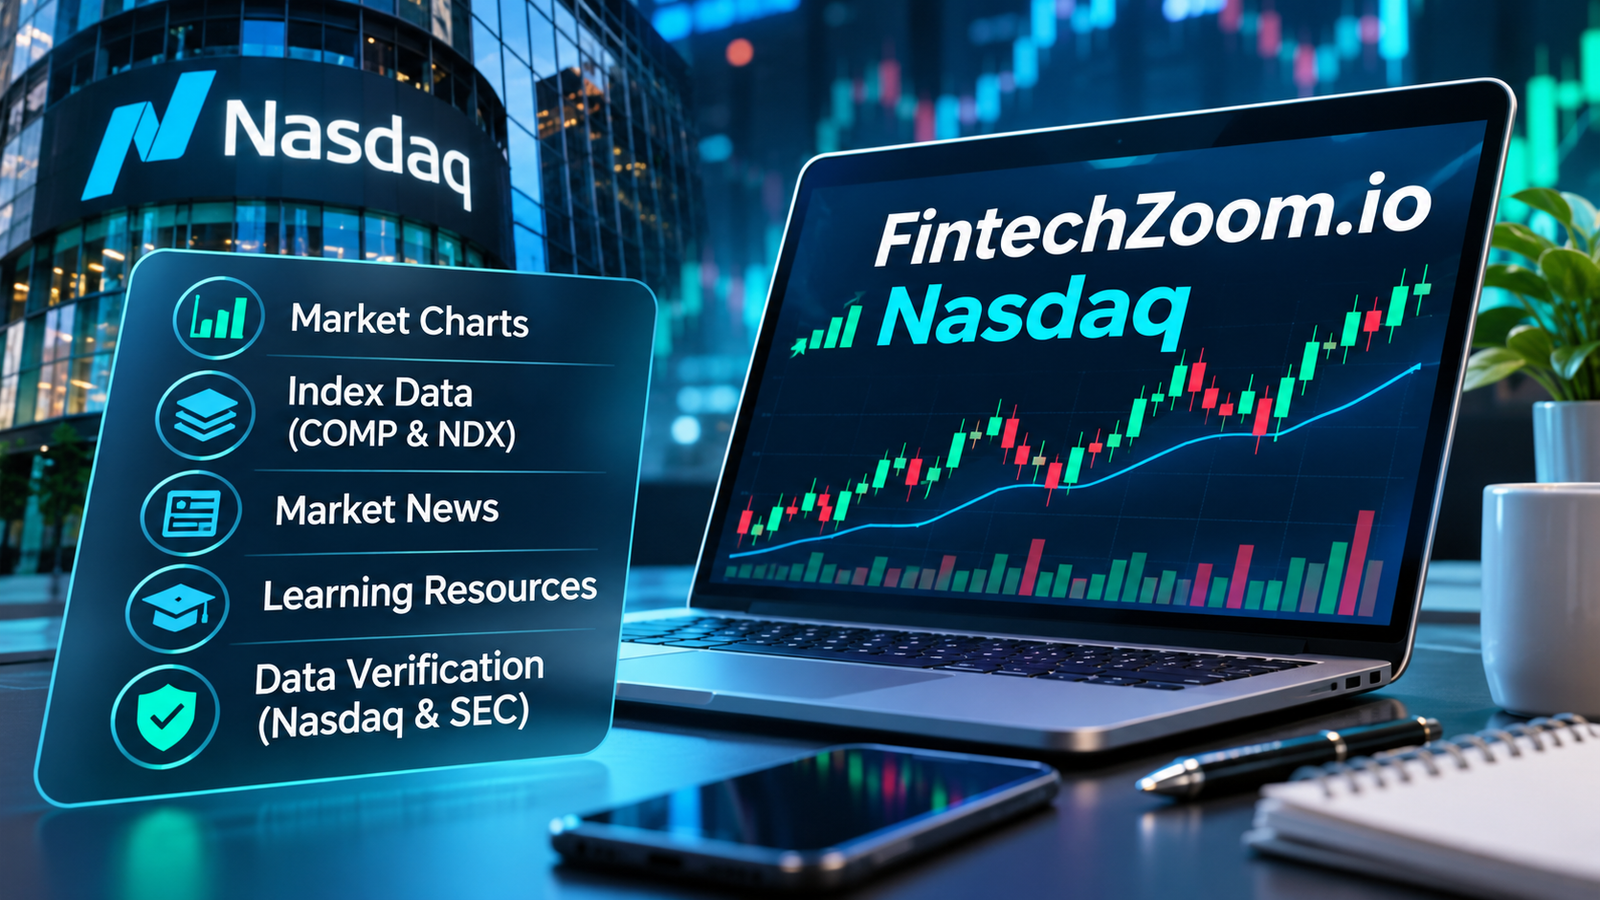
FintechZoom.io Nasdaq refers to Nasdaq-related financial information published on FintechZoom.io, including discussions of market indexes, stock charts, technology companies, and trading concepts. The website is not an official Nasdaq exchange or index service. Its published market commentary can provide research starting points, but readers should independently verify quotations, timestamps, data sources, and financial claims before relying on them.
The distinction matters because a chart labeled “Nasdaq” may represent the Nasdaq Composite, Nasdaq-100, an individual stock, or an exchange-traded fund. These are different financial instruments or benchmarks, and their values are not interchangeable.
This guide examines what FintechZoom.io describes, how Nasdaq indexes work, and a practical method for checking market information against authoritative sources.
What Does FintechZoom.io Nasdaq Actually Mean?
FintechZoom.io Nasdaq is a search phrase associated with FintechZoom.io’s Nasdaq-focused article, which discusses Nasdaq, stock market charts, financial technology, and market developments.
The indexed article is titled Nasdaq FintechZoom – Navigating the Past, Present & Future Charts. It explains Nasdaq-related concepts and describes the use of financial charts in market analysis.
However, the page’s existence does not mean FintechZoom.io operates a stock exchange, owns Nasdaq indexes, or supplies officially licensed market data.
Nasdaq is an established exchange operator and index provider. FintechZoom.io is a separate website discussing financial subjects.
This separation becomes particularly important when articles use terms such as real-time prices, technical analysis, market predictions, or investment tools.
Readers should distinguish between three things:
- Published information: Articles and explanations that readers can access.
- Advertised functionality: Features described by a website or third parties.
- Independently verified functionality: Features whose availability, operation, and source have actually been confirmed.
A financial article may be useful for education without meeting the standards required for time-sensitive trading decisions.
Nasdaq Market Basics: What Are You Really Tracking?
Before interpreting FintechZoom.io Nasdaq coverage, readers need to understand what the word Nasdaq represents.
It can refer to a stock exchange, a market index, an individual Nasdaq-listed company, or an investment product associated with an index.
Each has a different meaning.
The Nasdaq Stock Market vs. Nasdaq Indexes
The Nasdaq Stock Market is an electronic securities exchange where eligible securities are listed and traded.
A Nasdaq index, by contrast, is a calculated benchmark designed to represent the performance of a defined group of securities.
The exchange facilitates trading, while the index measures market performance according to established rules.
Investors can buy and sell individual stocks through brokerage accounts. They may also access investment products designed to track particular indexes.
However, an index value is not itself the price of an ordinary share that can be purchased directly.
This distinction explains why an index chart, a stock quotation, and an exchange-traded fund may display different values despite being connected to the same market.
Nasdaq Composite Index (COMP)
The Nasdaq Composite measures a broad universe of eligible common-type stocks listed on the Nasdaq Stock Market.
According to Nasdaq’s official Composite overview, the benchmark includes more than 2,500 companies.
Its wide coverage makes it useful for observing changes across the broader Nasdaq-listed equity market.
Although technology companies receive considerable attention, the Composite is not restricted to the technology sector.
Its performance depends on the companies included in the index and their respective weights.
The Composite is particularly relevant when readers want a broad picture of how Nasdaq-listed companies are performing.
Nasdaq-100 Index (NDX)
The Nasdaq-100 follows 100 of the largest eligible non-financial companies listed on Nasdaq.
Its constituents span industries including technology, telecommunications, retail, and biotechnology.
Financial companies are excluded under the index’s eligibility rules.
The Nasdaq-100 uses a modified market-capitalization-weighted methodology, meaning larger companies generally have greater influence, subject to concentration-related adjustments.
An important technical detail is that the index may contain more securities than companies because some businesses have multiple eligible share classes.
For example, Nasdaq’s official overview displayed 101 components during the November 14, 2026 research review, despite the index’s 100-company definition.
Company count and security count should therefore not automatically be treated as identical.
Nasdaq Composite vs. Nasdaq-100
| Feature | Nasdaq Composite | Nasdaq-100 |
|---|---|---|
| Official code | COMP | NDX |
| Coverage | Broad eligible Nasdaq-listed equity universe | 100 large eligible non-financial companies |
| Financial companies | May be included | Excluded |
| Weighting approach | Market capitalization weighted | Modified market capitalization weighted |
| Main use | Broad Nasdaq-listed market performance | Performance of large non-financial Nasdaq-listed companies |
| Official source | Nasdaq Composite overview | Nasdaq-100 overview |
Nasdaq also explains these distinctions in its article, Nasdaq Composite vs. Nasdaq-100: What Investors Should Know.
Why does this matter?
If a financial article reports that “Nasdaq gained 1%,” the reader should identify which index is being discussed.
The Nasdaq Composite and Nasdaq-100 can produce different daily returns because their constituents and weighting rules differ.
Assuming they represent identical market performance can lead to incorrect comparisons.
Why an Index Chart May Differ From Your Investment Portfolio
Even when an investment product tracks a particular index, its displayed return may differ from the index’s reported change.
Possible reasons include management fees, tracking differences, distributions, currency effects, and the timing of the comparison.
An exchange-traded fund also has its own trading price, which may temporarily differ from the value of its underlying holdings.
For example, a Nasdaq-100 index value and the price of a Nasdaq-100-linked ETF will not be numerically identical.
Readers should therefore identify the exact instrument before interpreting performance.
What Does FintechZoom.io Claim to Offer Nasdaq Readers?
FintechZoom.io’s indexed Nasdaq article discusses market indexes, charts, and financial analysis.
Several third-party articles also associate the website with technical indicators, market updates, investment commentary, and educational resources.
However, these descriptions are not equivalent to independently verified product testing.
Direct retrieval of the website’s Nasdaq article returned a server error during this research review.
Index and Stock Market Coverage
The website’s published material discusses Nasdaq and technology-oriented market developments.
Such coverage may help readers understand why indexes move, which sectors are attracting attention, and how market events relate to individual companies.
These are educational uses.
They do not establish that a website offers a direct, licensed Nasdaq data feed or brokerage execution services.
Charts and Technical Indicators
Technical analysis involves studying historical price movements, trading volume, and calculated indicators.
Common examples include moving averages, the Relative Strength Index (RSI), and Moving Average Convergence Divergence (MACD).
Moving averages can help readers identify price trends over a selected period. RSI is a momentum indicator, while MACD examines relationships between moving averages.
These tools describe aspects of historical market behavior; they do not reliably predict future returns.
Although competitors describe charting and technical-analysis features associated with FintechZoom.io, the functionality, data permissions, and exact indicator availability were not independently confirmed during this review.
Market News and Predictions
Market commentary can discuss interest rates, corporate earnings, economic releases, sector performance, or possible future scenarios.
These explanations may help readers understand the reasons analysts give for market movements.
However, forecasts should not be confused with confirmed outcomes.
A prediction based on technical indicators or artificial intelligence remains a prediction, even when presented through a sophisticated interface.
Readers should examine the assumptions, data dates, methodology, and uncertainty behind any market forecast.
Claimed Premium Tools and Educational Resources
Some third-party descriptions mention additional features such as alerts, premium subscriptions, AI-powered analysis, or structured learning resources.
Those descriptions do not independently establish that the features are currently operational or available under particular pricing plans.
The practical evidence status is summarized below.
| Feature or claim | Available evidence | Verification status |
|---|---|---|
| Nasdaq-related educational content | Indexed FintechZoom.io article | Confirmed as published content |
| Explanations of market charts | Indexed article and supporting descriptions | Content coverage confirmed |
| Live Nasdaq market feed | Third-party descriptions | Not independently verified |
| Proprietary forecasting technology | Competitor claims | Not independently verified |
| Premium subscription pricing | Inconsistent external descriptions | Not independently verified |
| Direct stock trading | No verified execution facility identified | Not established |
| Nasdaq ownership or endorsement | No official evidence identified | Not established |
The phrase “not independently verified” describes the limits of the evidence reviewed. It is not proof that a feature cannot exist.
How to Verify Nasdaq Market Data: A Practical Method
A credible market-data comparison requires more than checking whether two websites display similar numbers.
Even authoritative pages may use different timestamps, data licenses, quotation conventions, or reporting periods.
Nasdaq’s Market Activity documentation notes that many publicly displayed index values are subject to delays, including at least a one-minute delay for certain public index displays.
Therefore, a value marked “real-time” on an unrelated website should not automatically be assumed to be synchronized with every official public Nasdaq display.
Step 1: Identify the Correct Index or Stock Symbol
Start by recording what the displayed figure represents.
Is it COMP, NDX, a specific company’s stock, or an ETF?
Do not compare an index value against a stock price or another benchmark.
The correct symbol is the foundation of the entire comparison.
Step 2: Record the Date, Timestamp, and Trading Session
A quotation should be interpreted alongside its date, time, and time zone.
U.S. equity trading commonly involves regular sessions from 9:30 a.m. to 4:00 p.m. Eastern Time, with separate extended-hours trading arrangements for eligible securities.
Index calculations and individual security quotations may follow different display schedules.
A value from the previous closing session should not be compared with an intraday value without noting the difference.
For historical research, record the exact observation date rather than using labels such as “today” or “latest.”
Step 3: Check Whether the Data Is Real-Time or Delayed
Look for a clear data-status label.
Possible descriptions include real-time, delayed, previous close, historical, or end-of-day.
Nasdaq’s published display requirements explain the importance of identifying delayed market information.
If a third-party website gives no identifiable source or timestamp, the reader cannot reliably determine the freshness of the figure.
This limits its usefulness for time-sensitive decisions.
Step 4: Compare Against the Official Nasdaq Index Page
Open the official Nasdaq Composite or Nasdaq-100 overview.
Verify that the same index, date, and data type are being compared.
A historical closing value should be checked against the corresponding historical period.
If one site displays a last-traded price and another displays a previous close, the numbers may differ without either being inherently incorrect.
Step 5: Investigate Discrepancies
Suppose a third-party dashboard displays an illustrative Nasdaq-100 value of 24,500 at one timestamp, while another source displays 24,535 several minutes later.
These figures are hypothetical and are not actual observations from FintechZoom.io or Nasdaq.
The numerical difference is 35 index points, or approximately 0.14% relative to the first value.
Before drawing conclusions, determine whether the sources used matching times, indexes, market sessions, calculation versions, and display conventions.
The difference alone does not demonstrate that one source is inaccurate.
Step 6: Document Your Evidence
A simple verification record makes market research more transparent.
| Field | What to record |
|---|---|
| Instrument | COMP, NDX, stock ticker, or ETF |
| Source | Exact website or official index page |
| Date and time | Timestamp and time zone |
| Data status | Real-time, delayed, historical, or closing |
| Displayed value | Price or index level and percentage change |
| Comparison result | Match, difference explained, or unresolved |
This worksheet can be used whenever a financial website presents a Nasdaq figure.
It also creates a clear record of what was observed instead of relying on memory or a screenshot without context.
From a Nasdaq Headline to Official Company Evidence
A second verification challenge arises when financial articles discuss individual companies.
A headline may claim that a company’s revenue increased, earnings exceeded expectations, or management changed its financial outlook.
The underlying evidence is often available through official disclosures.
Identify the Company and Its Filing
Start with the company’s legal name and stock ticker.
Then open the U.S. Securities and Exchange Commission’s EDGAR filing search.
EDGAR provides public access to company disclosures, including annual reports, quarterly reports, and significant-event filings.
Common filing types include:
- Form 10-K: Annual financial and business reporting.
- Form 10-Q: Quarterly financial reporting.
- Form 8-K: Disclosure of certain significant corporate events.
These documents serve different purposes, so the filing type must match the claim being investigated.
Check the Reporting Period and Financial Measure
Suppose an article says a technology company’s revenue rose by 20%.
Before accepting the statement, determine which reporting periods were compared.
Was the increase year over year, quarter over quarter, or based on a full fiscal year?
Was the percentage calculated using reported revenue, adjusted revenue, or a particular business segment?
Those differences can materially change the interpretation.
Read the original filing and compare the relevant figures.
Separate Reported Results From Predictions
A company’s reported financial results are historical disclosures.
Management guidance and analyst projections concern possible future outcomes.
An earnings report may contain both.
Treating a forecast as an achieved result can mislead readers even when the numerical information is copied correctly.
The SEC’s investor research guidance encourages investors to understand financial information and conduct appropriate due diligence.
Primary filings provide a stronger foundation for fact-checking than repeatedly quoting the same financial commentary.
FintechZoom.io vs. FintechZoom.com vs. Official Nasdaq
Similar financial website names can create confusion, especially when their pages discuss the same markets.
FintechZoom.io, FintechZoom.com, and Nasdaq.com should not be treated as interchangeable.
| Website | Identifiable role | Important distinction |
|---|---|---|
| FintechZoom.io | Publishes Nasdaq and finance-related content | Not established as an official Nasdaq service |
| FintechZoom.com | Financial news and information website | Publishes its own domain and affiliation statements |
| Nasdaq.com | Nasdaq’s official website | Provides original exchange, index, and market resources |
What FintechZoom.com Says About FintechZoom.io
FintechZoom.com published an official-domain notice identifying fintechzoom.com as its website.
The notice also lists fintechzoom.io among domains that FintechZoom.com says are not affiliated with it and characterizes as impersonating its brand.
This is FintechZoom.com’s published position. It should not be presented as an independent legal finding against FintechZoom.io.
The reviewed evidence does not establish a common corporate owner or an official relationship between FintechZoom.io and Nasdaq.
For readers researching the other domain’s market coverage, features, pricing, and reliability, our complete FintechZoom.com review provides a separate assessment.
Keeping these identities distinct helps prevent branded search results from being mistaken for proof of ownership or financial authorization.
Can Beginners Use FintechZoom.io to Learn About Nasdaq?
Beginners can potentially use the website’s published Nasdaq explanations as introductory educational material.
The key is to distinguish reading financial content from receiving professional investment advice or accessing a fully verified trading service.
Learning About Indexes and Charts
A beginner may find explanations of market benchmarks, chart terminology, and investment concepts useful.
However, learning what an indicator measures is different from knowing when to buy or sell a security.
An investor also needs to consider financial circumstances, risk tolerance, diversification, investment horizon, and the limitations of market forecasts.
No chart pattern eliminates investment risk.
Understanding Market Education Courses
FintechZoom.io has also been associated with advertised financial education programmes.
Course descriptions may refer to stock-market basics, investing, technical concepts, and learning materials.
Readers interested in these programmes can consult our FintechZoom.io Stock Market Course review for a separate examination of course descriptions, costs, instructor transparency, and enrollment-related uncertainties.
A course advertisement does not establish teaching quality, professional accreditation, or the reliability of its investment methods.
Before enrolling, verify the actual provider, price, refund policy, instructor credentials, and course access terms.
Education Is Not Trade Execution
A website that publishes market education is not necessarily a brokerage.
Trading securities generally requires access to an appropriate brokerage or another authorized execution arrangement.
The availability of an actual FintechZoom.io-operated stock trading service was not established in this review.
Readers should independently verify the identity and regulatory status of any provider requesting funds, financial information, or trading-account access.
Benefits, Limitations, and Unverified Claims
FintechZoom.io’s Nasdaq-related material may offer educational value by bringing together familiar market concepts and helping readers identify topics for further research.
However, that potential usefulness needs to be separated from unsupported claims about technical performance.
Potential Benefits
- An accessible introduction to Nasdaq-related terminology.
- Background explanations of charts, indexes, and market movements.
- Connections between technology businesses and financial-market trends.
- A starting point for identifying questions that deserve primary-source research.
These are potential benefits of informational content, not independently measured platform-performance outcomes.
Important Limitations
Data freshness is uncertain. The reviewed evidence does not establish the timing, source, or contractual permissions of any live Nasdaq feed supplied through FintechZoom.io.
Forecasting reliability is unproven. Descriptions of technical or AI-driven analysis do not demonstrate predictive accuracy.
Service capabilities remain partly unverified. Claims involving subscriptions, alerts, premium features, or trading functionality require direct confirmation.
Financial content can become outdated. Market conditions, index constituents, regulatory requirements, and company disclosures change over time.
Brand similarity is not proof of affiliation. A similar domain name does not establish corporate ownership, licensing, endorsement, or regulatory approval.
These limitations make independent verification especially important when the information could influence financial decisions.
Best Primary Sources for Nasdaq Research
Readers who want reliable market information should know where to find original documentation.
Nasdaq Indexes
The official Nasdaq indexes website provides benchmark definitions, methodology links, constituent information, and related research.
Start with the Nasdaq Composite overview or Nasdaq-100 overview, depending on the benchmark being investigated.
Nasdaq Market Activity
Nasdaq Market Activity provides market-related information and explains important display conventions, including index-data timing.
Check each page’s source and delay disclosures before using figures in a time-sensitive comparison.
SEC EDGAR
SEC EDGAR provides access to public company disclosures.
It is particularly useful for checking financial results, risk disclosures, and reported corporate events.
Investor.gov
Investor.gov explains investment research, risks, products, and investor-protection considerations.
For decisions involving securities professionals, readers can also use the regulator’s available background-check resources.
Together, these references provide a more dependable research foundation than relying on a single third-party market article.
Frequently Asked Questions
Q1: Is FintechZoom.io Nasdaq an Official Nasdaq Platform?
Ans: No official Nasdaq ownership, endorsement, or operational relationship was established in the reviewed evidence.
Q2: Does FintechZoom.io Provide Verified Real-Time Nasdaq Data?
Ans: The available evidence does not establish the real-time accuracy, data source, latency, or licensing status of any Nasdaq feed provided by FintechZoom.io. Readers should verify quotations through appropriately sourced financial data services.
Q3: Is FintechZoom.io the Same as FintechZoom.com?
Ans: The domains are different. FintechZoom.com has published a notice stating that FintechZoom.io is not affiliated with it. That notice represents FintechZoom.com’s own statement, and readers should not assume common ownership based on the similar names.
Q4: Can You Trade Nasdaq Stocks Directly Through FintechZoom.io?
Ans: A functioning, authorized FintechZoom.io-operated securities trading service was not independently verified during this research. Articles and charts alone do not establish brokerage capabilities.
Q5: What Is the Difference Between COMP and NDX?
Ans: COMP identifies the Nasdaq Composite, which covers a broad group of eligible Nasdaq-listed stocks. NDX identifies the Nasdaq-100, which follows 100 large eligible non-financial companies. Their composition and weighting rules differ.
Q6: How Do You Verify a Nasdaq Stock Quote?
Ans: Identify the ticker, company, exact market session, timestamp, time zone, data source, and quotation status. Compare the information with a suitable official or authorized financial data source. For company financial claims, consult original SEC filings.
Final Verdict
FintechZoom.io Nasdaq is best understood as a branded search topic connected to a third-party website’s Nasdaq-related financial content, rather than an official Nasdaq market service.
Its published explanations may help readers explore financial terminology, market charts, and technology-sector developments. However, important claims about real-time market information, subscription tools, and trading functionality remain insufficiently verified.
The strongest research approach is to identify the exact market instrument, check data freshness, compare figures with original Nasdaq references, and use SEC disclosures for company-specific claims.
FintechZoom.io may serve as an educational starting point, but independently verified primary sources should remain the foundation of consequential investment research.